Loading 33,000 Peaks on Demand with a z10 Tile Grid

How biwak.info shows every named peak of the Alps on a Leaflet map without loading a 15 MB file: the peaks are cut into the same z10 tiles the map uses, and the browser only fetches the few tiles the current view needs.
biwak.info is my mobile-first map of Alpine huts and bivouacs. Recently I wanted to add peaks: tap anywhere near a summit and get its name, elevation, prominence, a photo and the Wikipedia link. The data for that comes from OpenStreetMap and Wikidata: 33,437 named peaks between Nice and Vienna.
As a single peaks.json file this is 15.4 MB (1.8 MB gzipped). That's fine for
a desktop, but on a phone with one bar of signal in a valley it is not, and most
of it is never used: you look at one valley, not the whole Alps.
The site is hosted as plain static files, without a database or an application server, and I wanted to keep it that way. So the question was: how do you load only the peaks the user is looking at, using nothing but files?
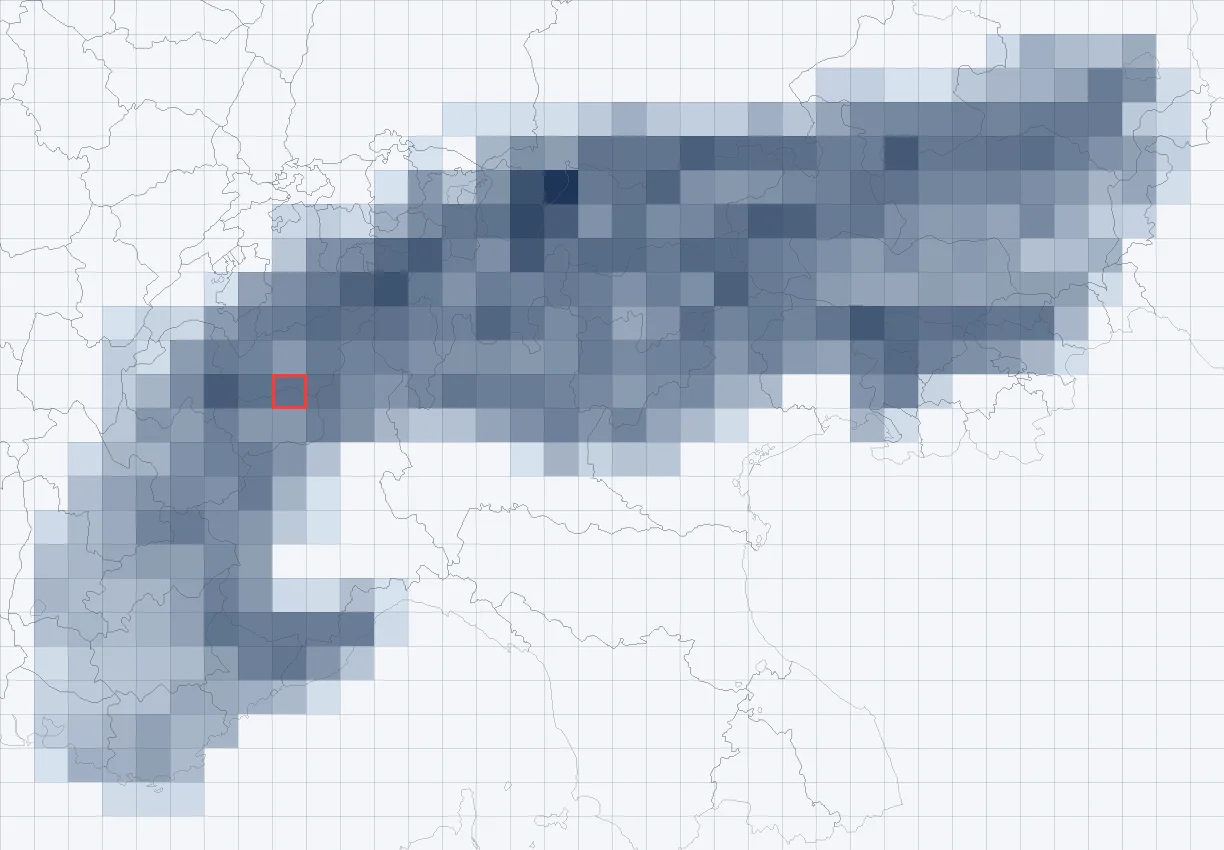
Use the map's own tile grid
Leaflet already splits the world into a grid: the slippy map tiles z/x/y that
every OpenStreetMap-style basemap uses. At zoom level z there are 2^z × 2^z
tiles, and any coordinate maps to exactly one of them with two lines of math:
def lon2x(lon, z=10):
    return math.floor((lon + 180) / 360 * 2**z)


def lat2y(lat, z=10):
    lat_rad = math.radians(lat)
    return math.floor((1 - math.log(math.tan(lat_rad) + 1 / math.cos(lat_rad)) / math.pi) / 2 * 2**z)
The idea: cut the peaks into files along that same grid at one fixed zoom
level, one JSON file per tile. The browser computes which tiles cover the
current view and fetches only those. Because the build (Python) and the client
(JavaScript) use the same formula, they always agree on which file a peak is in.
The floor also means every peak belongs to exactly one tile, so nothing is
duplicated.
The Matterhorn (45.97639, 7.65833) for example lands in tile 10/533/364. I keep
a handful of these as unit test fixtures for the build and the client.
Why zoom level 10
The zoom level of the data grid is independent of the zoom level the map is showing. It is a trade-off between the number of requests and the size of each file:
- A z10 tile is about 27 × 27 km in the Alps.
- Peaks are only drawn from map zoom 12 on. There a phone screen (390 × 790 px) shows roughly 10 × 21 km. With a 25% margin around the view to preload neighbours, a view touches at most 6 tiles at zoom 12 and 4 at zoom 13.
- The whole Alps fit into 356 non-empty tiles. A tile holds 93 peaks in the
median, the densest one 348: tile
541/358in the Allgäu Alps, with the Hochvogel and Krottenkopf. - A tile is 13 KB of JSON in the median (3.6 KB gzipped), the largest 87 KB.
At z9 the tiles would hold four times as many peaks, so most of each download would be off-screen. At z11 a view would need four times as many requests. z10 is the sweet spot for this density of data.
The build: one small file per tile
A Python script (tools/build_peaks.py) reads the big peaks.json and writes
the grid:
data/peaks/manifest.json      non-empty tiles with peak counts
data/peaks/10/{x}/{y}.json    one file per tile
Each tile is a compact table: a fields header and one array per peak, instead
of repeating the key names thousands of times. Coordinates are stored as integers
in 1e-5 degrees, which is about one meter and saves the long float strings:
{"cat": 1,
 "fields": ["id", "lat_e5", "lon_e5", "ele", "rank", "name", "prominence", "wikipedia", "wikidata", "image", ...],
 "rows": [
   ["n26863664", 4597643, 765860, 4478, 3, "Matterhorn", 1038, "it:Cervino", "Q1374", "https://...", ...],
   ["n1436639948", 4603418, 761193, 4358, 3, "Dent Blanche", 915, null, "Q15125", "https://...", ...]
 ],
 "x": 533, "y": 364, "z": 10}
The manifest lists only the tiles that exist (7 KB). The client checks it first and never requests a tile over the Po valley or the Mediterranean that would only return a 404.
The build is deterministic: the same input gives byte-identical files. That
keeps the git diffs readable when the OSM data changes, and rsync only uploads
the tiles that really changed.
Not every peak at every zoom
At zoom 12 the Alps are full of small bumps that are technically named peaks. So every peak gets a rank from 0 to 3 at build time. The rank comes from the prominence (how far you have to descend before you can climb anything higher) or, if that is unknown, from the isolation (the distance to the nearest higher peak):
def peak_rank(ele, prominence, isolation_km):
    if ele is None:
        return 0
    if prominence is not None:
        return 3 if prominence >= 500 else 2 if prominence >= 150 else 1 if prominence >= 50 else 0
    if isolation_km is None:
        return 0
    return 3 if isolation_km >= 5 else 2 if isolation_km >= 2 else 1 if isolation_km >= 0.8 else 0
That gives 1,558 peaks with rank 3, 7,385 with rank 2, 18,015 with rank 1 and 6,479 with rank 0. The rows in each tile are sorted by rank, then by elevation. The map shows rank ≥ 2 at zoom 12, rank ≥ 1 at zoom 13 and everything from zoom 14 on.
The client: fetch what the view needs
In the browser (peaks.js) it all hangs off Leaflet's moveend event. From zoom
11 on, one zoom level before anything is drawn, the visible bounds plus a 25%
margin are turned into tile keys. Missing tiles are queued:
function* tileKeys(bounds) {
  const x0 = lon2x(bounds.getWest()), x1 = lon2x(bounds.getEast());
  const y0 = lat2y(bounds.getNorth()), y1 = lat2y(bounds.getSouth());
  for (let x = x0; x <= x1; x++) for (let y = y0; y <= y1; y++) yield `${x}/${y}`;
}

function loadVisiblePeakTiles() {
  if (!peakManifest || map.getZoom() < LOAD_FROM_ZOOM) return;
  for (const key of tileKeys(map.getBounds().pad(VIEW_PAD))) {
    if (!(key in peakManifest.tiles) || peakTiles.has(key) || peakTileState.has(key)) continue;
    peakTileState.set(key, 'loading');
    fetchQueue.push(key);
  }
  pumpFetchQueue();
}

map.on('moveend', loadVisiblePeakTiles);
A few details made it work well on a phone:
- At most 4 requests in parallel, so a fast pan doesn't fire a dozen fetches at once. A failed tile is retried once after two seconds and otherwise skipped for the session. The map keeps working, just without peaks in that square.
- An LRU of 64 tiles. A JavaScript
Mapkeeps insertion order, so deleting and re-inserting a key on every use turns it into an LRU for free. When there are more than 64 tiles, the least recently used ones are dropped, but never one that is in the current view. - Rows become objects shaped like the hut records, so the existing detail view shows peaks without any changes.
Drawing: one canvas, no markers
33,000 Leaflet markers would be far too heavy, and the basemap
(OpenTopoMap) already prints peak names and
elevations. So the peaks layer is a single <canvas> on its own map pane that
draws small, slightly transparent grey triangles after each move. During a zoom
animation the canvas is hidden, because it isn't transformed with the map. It
is redrawn on zoomend.
Tapping is a nearest-neighbour search over the loaded tiles: anything within 30 px of the tap counts, from zoom 12 on. The search box can span a tile border, so it looks at all tiles it touches. A peak right at the edge of its tile is still found when you tap just across the line.
Deep links come for free
Since then every hut and peak also has a stable URL like
biwak.info/p/matterhorn. For a peak, the slug
lookup only needs to store its coordinates: the client computes the tile from
them with the same lon2x/lat2y, fetches that one file and opens the peak.
The grid works as a spatial index that needs no extra code.
What I'd do next
- More categories. Passes, viewpoints, springs and drinking water can use the same grid. Their files only need a category field and a per-category count in the manifest, so the client can skip tiles without any enabled category.
- Vector tiles. If the map ever moves to MapLibre, the same build pipeline could write MVT tiles instead of JSON. The grid and the ranking would stay.
For data of this size, tens of thousands of points over a mountain range, the plain file grid works very well: no server, no database, a few kilobytes per view, and the whole thing is about 430 lines of Python and JavaScript.