Scale-Aware Rating of Count Forecasts

Our ML group at Blue Yonder, with Malte Tichy, has published a new paper on Scale-Aware rating of Count Forecasts.
Forecast accuracy is something every data team tracks — but judging how good a forecast actually is turns out to be much harder than it looks. This paper introduces a simple but powerful idea: you can’t fairly judge a forecast unless you compare it to what is theoretically possible.
The core problem: numbers lie (a little)
Most businesses use familiar metrics like MAE, WMAPE, or similar error scores to evaluate forecasts. The problem? These numbers are heavily influenced by how fast something sells.
- Slow-moving products (selling ~1 unit/day) behave very differently from fast movers (selling ~100/day).
- Even a perfect forecast will look worse for slow movers, simply because randomness dominates.
- Comparing raw error numbers across products, categories, or departments often leads to the wrong conclusions.
A useful mental model: the Poisson limit
In many retail and demand settings, sales are fundamentally noisy. Even with perfect information, you can’t predict the exact number sold tomorrow.
The paper a Poisson distribution as a practical benchmark:
- It represents the sharpest (least noisy) forecast you can reasonably hope for.
- If your forecast behaves like Poisson noise, you’re already close to optimal.
- If it’s much noisier, there may be room to improve.
The key insight: Instead of asking “What error did I get?”, ask “How far am I from the best possible error?”
To avoid misleading comparisons, the authors propose a simple workflow:
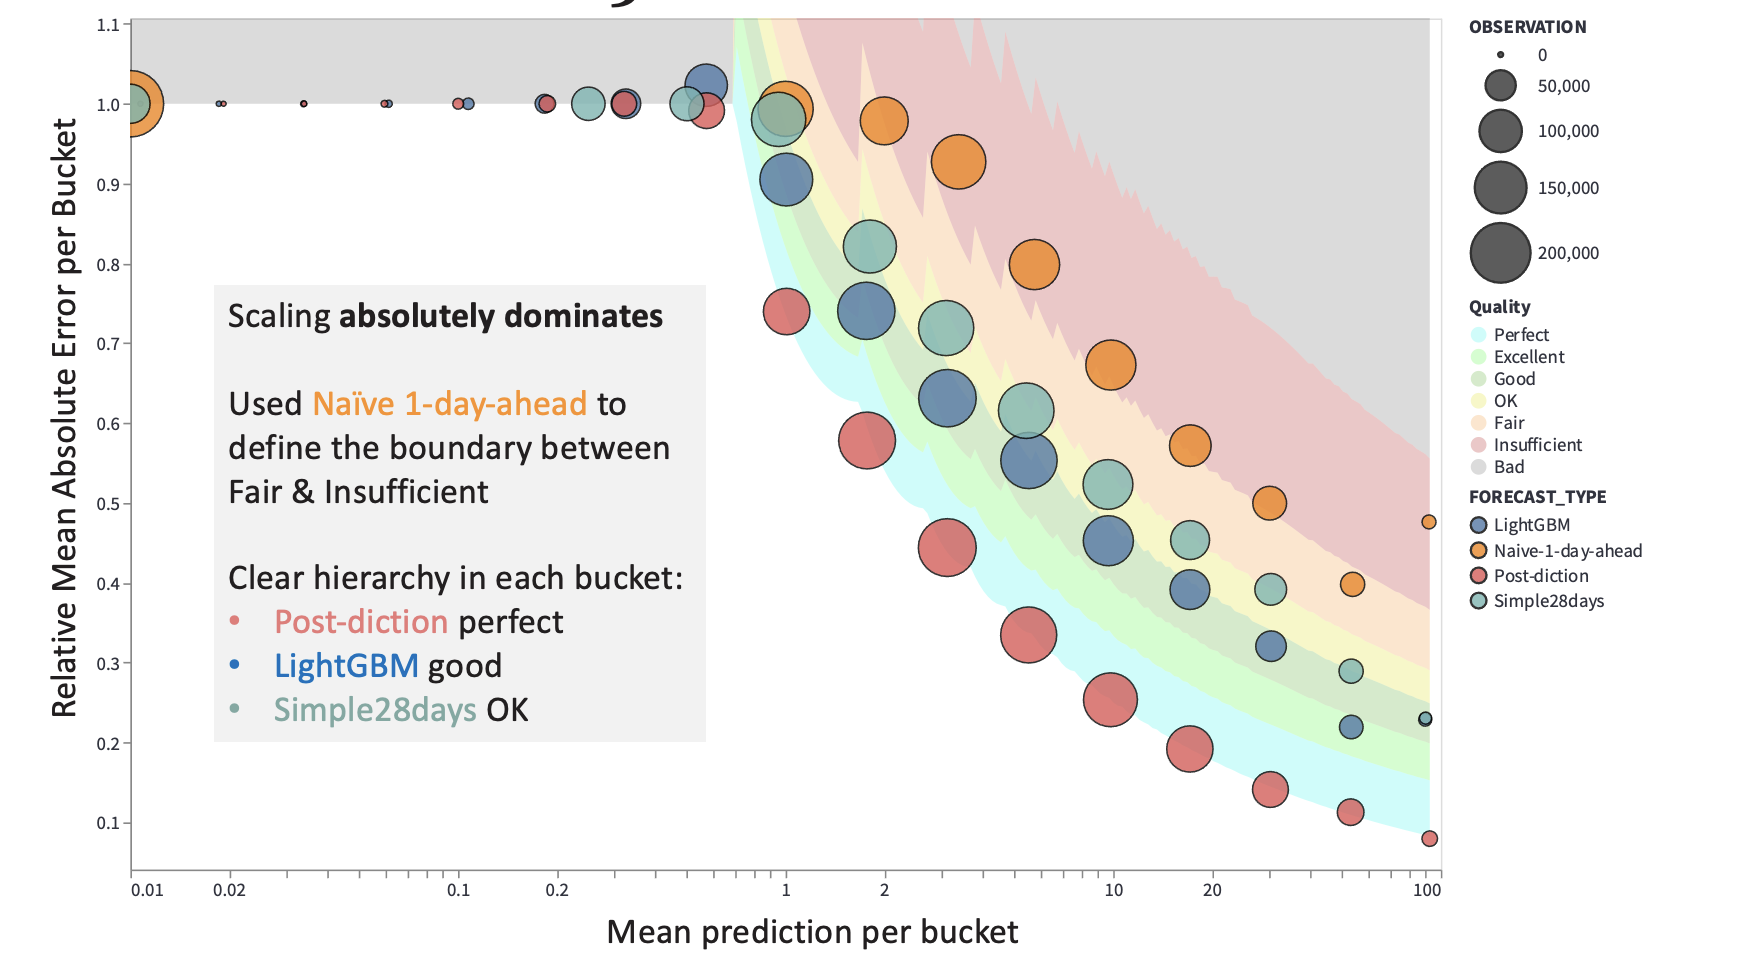
- Group predictions with similar expected values (e.g. ~0.1, ~1, ~10, ~100 units).
This ensures you’re comparing:
- Slow movers with slow movers
- Fast movers with fast movers
For each bucket, calculate what error you’d expect from a theoretically perfect (Poisson) forecast.
Instead of raw numbers, each bucket gets a quality rating, and error metrics become interpretable:
- A WMAPE of 50% might be excellent for slow movers
- The same number could be unacceptable for fast movers
By anchoring evaluation to what’s theoretically achievable and comparing forecasts at the right scale, this method turns confusing error numbers into clear, actionable insight. If you work with demand forecasting — especially across products with very different sales volumes — this way of thinking can save you a lot of time, effort, and frustration.
Additional Information
Malte will also talk about this at PyData Global:
Meaningful probabilistic models not only produce a "best guess" for the target but also convey their uncertainty, i.e., a belief about how the target is distributed around the point estimate. Business evaluation metrics such as mean absolute error a priori neglect this unavoidable uncertainty. This talk discusses why and how to account for uncertainty when evaluating models with traditional business metrics, using Python standard tooling. The resulting uncertainty-aware model rating satisfies the requirements of statisticians because it accounts for the probabilistic process that generates the target. It should please practitioners because it is based on established business metrics. It should also appeal to executives because it enables concrete quantitative goals and non-defensive judgments.